PHM Data Challenge
Results!
The 2017 Data Challenge attracted 34 teams from all over the world. 17 teams submitted final results for the validation dataset. The preliminary final ranking is given below. Full details will be provided at the conference.
| Rank | Team Name | Final Score (Max. 1.0) |
| 1 | K2 | 0.762 |
| 2 | Tony2017 | 0.706 |
| 3 | KTX | 0.654 |
| 4 | Maxtropy | 0.62 |
| 5 | RealMonitor | 0.551 |
| 6 | kingfisher | 0.55 |
| 7 | JPU | 0.54 |
| 8 | OFO | 0.534 |
| 9 | Pandora | 0.53 |
| 10 | D218 | 0.526 |
| 11 | xiaoba | 0.515 |
| 12 | Emiya | 0.51 |
| 13 | PHMLAB_RSE_BUAA | 0.414 |
| 14 | BogieMiner | 0.414 |
| 15 | Triangle | 0.413 |
| 16 | Finch | 0.383 |
| 17 | Dzien_Dobry | 0.338 |
Call for Participation

Click image above to download pdf
|
The PHM Data Challenge is a competition open to all potential conference attendees. This year the challenge is focused on tracking the health state of components within a complex mechanical system representing a train car. Participants will be scored based on their ability to predict health state of various system components.
This is a fully open competition in which collaboration is encouraged. The teams may be composed of any combination of students, researchers and industry professionals. The results will be evaluated by the Data Challenge Committee and all teams will be ranked. The top three scoring teams will be invited to present at a special session of the PHM conference and will be recognized at the Conference banquet event. Data Challenge Chairs (data@phmconference.org) |
Note: Training and testing data can be downloaded from the link at the bottom of this page (under “Attachment”).
Teams
Collaboration is encouraged and teams may be comprised of one or more students and professionals. The team judged to have the first, second, and third best scores will be awarded prizes of $600, $400, and $200, respectively, contingent upon:
- Having at least one member of the team attend the PHM 2017 Conference.
- Submitting a peer-reviewed conference paper. Submission of the data challenge special session papers is outside the regular paper submission process and follows its own modified schedule.
- Presenting the analysis results and technique employed at a special session within the Conference program.
The organizers of the competition reserve the right to both modify these rules and disqualify any team for any practices it deems inconsistent with fair and open practices. In addition, the top entries will also be encouraged to submit a journal-quality paper to the International Journal of Prognostics and health Management (ijPHM).
Registration
Teams may register by contacting the Competition organizers (via the data@phmconference.org e-mail) with their name(s), affiliation, and a team alias under which the scores would be posted. Please note: In the spirit of fair competition, we allow only one account per team. Please do not register multiple times under different user names, under fictitious names, or using anonymous accounts. Competition organizers reserve the right to delete multiple entries from the same person (or team) and/or to disqualify those who are trying to “game” the system or using fictitious identities.
Key PHM Data Challenge Dates
PHM Conference Dates2-6 Oct 2017
| Key Dates | |
|---|---|
| Competition Open | 22 May 2017 |
| Training and Testing Data Posted | 22 May 2017 |
| Final Validation Set Posted | 15 Aug 2017 |
| Competition Closed | 27 Aug 2017, noon PST |
| Preliminary Winners Announced | 4 Sep 2017 |
| Winners Announced | 18 Sep 2017 |
| Winning Papers Due | 22 Sep 2017 |
Daily automatic evaluation of submissions
Data challenge announcement has stated that registered teams can send only one test data submission per team per week (on Mondays by Noon PST deadline) to data@phmconference.org.
Update: We have automated the submission evaluation process and every team can send a test submission per day. All the teams registered will receive an account and password for online submissions on their first submission to data@phmconference.org. Any team can explore the evaluation scores/errors and the history of submission results immediately.
System Description
This year’s challenge continues the trend started in the previous years and is focused on the combination of physics-based modeling and statistical approaches for prediction. It is recommended that the solution you design and implement use physics-based modeling elements. Points will be given to those approaches that provide a physical connection to the data such as health states of various components, relationship between data and model parameters or states, etc.
The system under investigation is a conventional bogie vehicle. Figure 1 depicts a schematic diagram of a bogie vehicle model, consisting of a vehicle body, two bogies and four wheelsets. The simplified model includes coil springs and dampers used in the primary suspension, and air springs in the secondary suspension. Sensors are placed on the wheelsets, on the bogie frames and on the car body as shown in the figure. Random track irregularities, roughness and faults will induce vibrations along each axis.
The vehicle is operated on tracks with different irregularities, layouts, contact geometries and speeds. Additionally the vehicle parameters like loading, stiffness and damping rates vary in some range even in experiments without faults in the components.
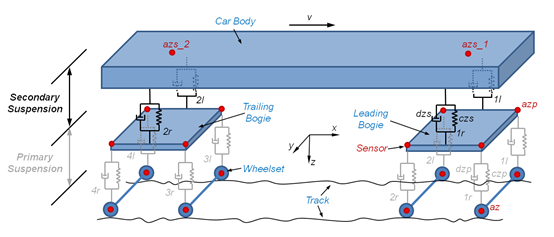
Figure 1. Diagram of a simplified vehicle model (See [1]). Red dots are sensor locations.
In this challenge, features from the following sensors are available:
- az_il, az_ir – vertical acceleration of wheelset axle (i = 1,2,3,4)
- azp_il, azp_ir – vertical acceleration on bogie frame primary suspension level (above wheelset axle, i = 1,2 for leading bogie, and i = 3,4 for trailing bogie)
- azs_i, azs_i – vertical acceleration on car body secondary suspension level (i = 1 above the leading bogie, and i = 2 above the trailing bogie)
Additionally, the vehicle speed, the actual car body mass (including loading) and the track on which the train is currently driving are available.
Objectives
The primary objective of this challenge is to predict faulty regimes of operation of a train car using the data provided and physics-based modeling methods (e.g. inspired in any relevant reference such as the ones included in this document). Typical model parameters for the vertical system are depicted in Figure 1. The data provided represents time series of various features computed from raw sensor data. Features are computed over contiguous time intervals called experiments. The condition of the bogies is considered constant over one experiment but may change from experiment to experiment. In the second objective, when a faulty condition of a bogie is determined the challenge is to predict the faulty component(s). At most two components may exhibit a fault at any given time. The latter can help to determine the likely root cause for the fault.
Data Description
Training and testing data sets are provided (see bottom of webpage) to participants to establish their methods. The data given represents spectral features over non-overlapping frequency bands calculated from filtered sensor signals in sequential time frames, for typical frequencies discussed in the literature. One experiment consists of a matrix of 90 feature values over time.
Table 1: The following table indicates the available features and the sensor underlying the raw data for each feature. Five features are given as a feature set for each sensor, representing spectral information in non-overlapping frequency bands for increasing frequencies. The k-th (k=1…5) feature in each feature set is computed in the same way across sensors.
| Feature set per sensor | Sensors |
|---|---|
| f101 – f105 | azs_1 |
| f106 – f110 | azp_1r |
| f111 – f115 | azp_1l |
| f116 – f120 | azp_2r |
| f121 – f125 | azp_2l |
| f126 – f130 | az_1r |
| f131 – f135 | az_1l |
| f136 – f140 | az_2r |
| f141 – f145 | az_2l |
| f146 – f150 | azs_2 |
| f151 – f155 | azp_3r |
| f156 – f160 | azp_3l |
| f161 – f165 | azp_4r |
| f166 – f170 | azp_4l |
| f171 – f175 | az_3r |
| f176 – f180 | az_3l |
| f181 – f185 | az_4r |
| f186 – f190 | az_4l |
Table 2: Experiments provided.
| ExperimentID | Payload | Speed | Track | State |
|---|---|---|---|---|
| 1 | 1.02 | 1.04 | 1 | healthy |
| 2 | 1.96 | 1.03 | 1 | healthy |
| 3 | 0.89 | 1.03 | 2 | healthy |
| … | ||||
Table 3: Faults of interest.
| Number | Bogie | Component | Position |
|---|---|---|---|
| 1 | leading | Primary Spring | czp_1r |
| 2 | Primary Spring | czp_1l | |
| 3 | Primary Spring | czp_2r | |
| 4 | Primary Spring | czp_2l | |
| 5 | Primary Damper | dzp_1r | |
| 6 | Primary Damper | dzp_1l | |
| 7 | Primary Damper | dzp_2r | |
| 8 | Primary Damper | dzp_2l | |
| 9 | Secondary Spring | czs_1 | |
| 10 | Secondary Damper | dzs_1r | |
| 11 | Secondary Damper | dzs_1l | |
| 12 | trailing | Primary Spring | czp_3r |
| 13 | Primary Spring | czp_3l | |
| 14 | Primary Spring | czp_4r | |
| 15 | Primary Spring | czp_4l | |
| 16 | Primary Damper | dzp_3r | |
| 17 | Primary Damper | dzp_3l | |
| 18 | Primary Damper | dzp_4r | |
| 19 | Primary Damper | dzp_4l | |
| 20 | Secondary Spring | czs_2 | |
| 21 | Secondary Damper | dzs_2r | |
| 22 | Secondary Damper | dzs_2l |
Training data will be given in a collection of files “Training-ddd.csv” representing instances for all 90 features (f101,…,f190) described in Table 1 for all experiments described in Table 2. It only represents nominal operation, where all systems and subsystems operate in a healthy manner. Testing data will be given in a collection of files “Testing-ddd.csv” analogous to the training data. It includes both nominal and faulty regimes of operation. No fault number or position information will be provided for faulty regimes. Participants need to predict (1) the condition of each train car (healthy or faulty); and (2) the type of fault (if the condition of a bogie is faulty), according to the types of faults given in Table 3. The latter represents a more refined prediction that indicates the subcomponent(s) (maximum two) inducing the fault.
Scoring and Submissions
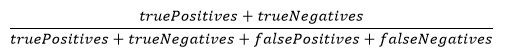
During active competition, team scores will be calculated as the sum of the scores for the two objectives. For the first objective, the correct prediction of healthy and faulty regimes of operation of a car will be scored using the accuracy rate measure:
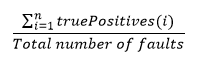
For the second objective, the sensitivity in detecting specific faults will be measured by the fraction of the sum of correct individual fault type predictions (for all fault types) over the total faulty instances:
Only one submission will be accepted per team per week (on Mondays by Noon PST deadline). The submission file name should be the team alias, e.g. “team_alias.zip” and it should contain “Testing-Predictions.csv“. An example of the format of a typical weekly submission is given in the file “Sample-Predictions.csv“. Team performance scores will be posted every Monday.
The final submission is due by the “Competition Closed” deadline and should include a 2/3-page description of the physics-based modeling method utilized and the predicted health states on a validation dataset to be posted several weeks before the competition closes.
After the competition is closed, the final score will be calculated for all submissions based on the sum of scores for the two objectives for predicting general faulty condition and specific bogie faults (90% weight) and the description of the physics-based modeling approach (10% weight). The physics-based modeling approach should be intrinsic in the approach taken for predicting specific bogie fault conditions, and its description will be judged based on criteria such as use of estimates of any of the simplified model parameters from Figure 1, use of physical constraints amongst parameters, or use of any other physics-based elements from the literature.
Submissions and questions about the data challenge should be emailed directly to the organizers (data@phmconference.org). A summary of the questions asked and answers will be posted for all participants on the PHM society Data Challenge web page.
References
- T. X. Mei & X. J. Ding (2009): Condition monitoring of rail vehicle suspensions based on changes in system dynamic interactions, Vehicle System Dynamics, 47:9, 1167-1181.
- S. Bruni , J. Vinolas , M. Berg , O. Polach & S. Stichel (2011): Modelling of suspension components in a rail vehicle dynamics context. , Vehicle System Dynamics, 49:7, 1021-1072.
- S. Iwnicki (1998): Manchester Benchmark for Rail Vehicle Simulation. Vehicle System Dynamics, 30:7, 295-313.